In the world of options trading, one pattern stands out as a powerful indicator of market sentiment and risk.
The volatility smile reveals hidden dynamics that can shape profits and losses.
Understanding it is key to navigating complex financial markets with confidence.
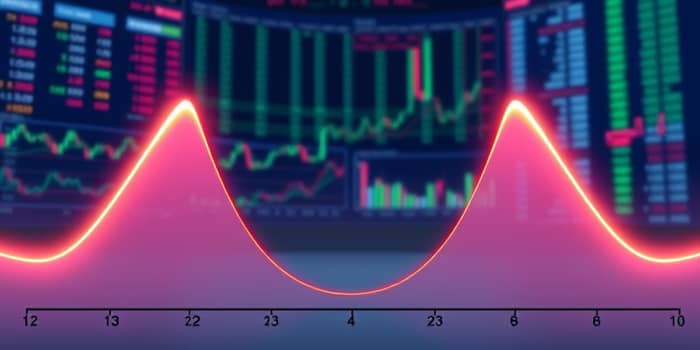
The volatility smile is a U-shaped curve where implied volatility is higher for deep in-the-money and out-of-the-money options.
This pattern deviates from traditional models, reflecting real-world market behaviors.
It forms a symmetrical smile on charts, with wings rising on both sides.
The lowest point is at at-the-money strikes, indicating lower volatility expectations there.
This phenomenon highlights the limitations of assumptions like those in the Black-Scholes model.
Volatility smiles became prominent after events like the 1987 Black Monday crash.
Markets began pricing in higher chances of substantial price swings.
This pattern is common in currencies and commodities with bidirectional risks.
It signals a recalibration of risk perceptions in stable yet volatile environments.
Several factors contribute to the volatility smile.
These drivers create the distinctive U shape on volatility charts.
They reflect real-world investor behavior and hedging needs.
To enrich understanding, here is a comparison table.
This table clarifies key differences in market applications.
The volatility smile affects option pricing and trading strategies.
OTM and ITM options often trade at premiums due to higher implied volatility.
This inflates sensitivities like Vega and Delta in option Greeks.
Recognizing these insights can help traders spot mispricings.
It empowers them to make informed decisions based on market expectations of volatility.
Traders exploit the volatility smile through various strategies.
Selling high-IV OTM or ITM options and buying low-IV ATM options is common.
Profits arise as implied volatility normalizes over time.
For example, in a Reverse Iron Fly on Asian Paints, breakevens are calculated based on strike prices.
This strategy profits from significant price movements outside a range.
Engaging with the volatility smile offers advantages and challenges.
Understanding these aspects helps in managing expectations and risks.
It allows traders to leverage anomalies for potential gains.
Effective analysis requires the right tools and techniques.
These tools enable traders to monitor and adjust strategies dynamically.
They support a deeper dive into market dynamics and pricing anomalies.
The volatility smile extends beyond trading to risk measurement in finance.
It is relevant in FRM and CFA contexts for portfolio safeguarding.
Visuals like U-shaped graphs and payoff diagrams aid in comprehension.
Examples from historical events, such as the 1987 crash, provide context.
Embracing this knowledge fosters resilience and adaptability in markets.
It encourages continuous learning and innovation in trading approaches.
By harnessing the volatility smile, traders can navigate uncertainties with greater confidence.
This pattern serves as a reminder of market complexity and opportunity.
Let it inspire you to explore and master the art of options trading.
References